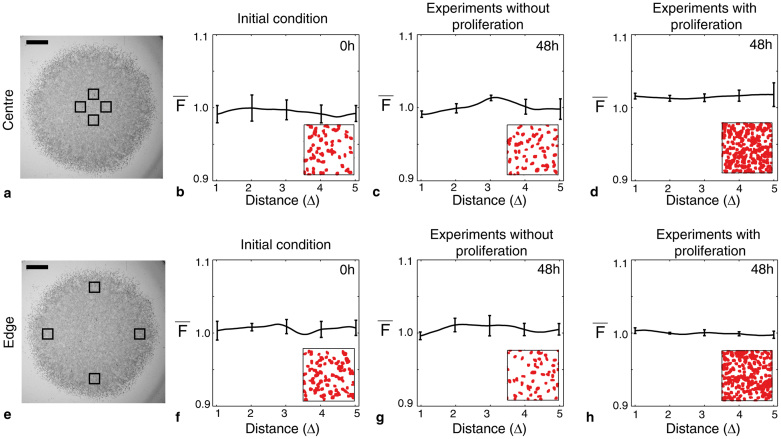
Figure 4. Spatial correlations are not present in spreading MM127 melanoma cell populations.
Average pair correlation functions were extracted from images showing the location of individual cells in four subregions, each of dimension 600 μm × 600 μm, at the centre of the spreading cell population (a) and four subregions, each of dimension 600 μm × 600 μm, at the edge of the spreading cell population (e). The relative size and approximate location of these subregions is shown in (a) and (e), respectively, where the scale bar corresponds to 1,500 μm. Average pair correlation signals are shown at t = 0 hours in (b) and (f), at t = 48 hours for experiments without cell proliferation in (c) and (g), and at t = 48 hours for experiments with cell proliferation in (d) and (h). Results in (b–d) and (f–h) correspond to pair correlation signals computed at the centre and at the edge of the spreading cell population, respectively. The horizontal axis is measured as multiples of the average diameter of the nucleus which is approximately 18 μm. Snapshots of the experimental subregions after image processing are shown as an inset. The size of the inset is approximately 215 μm × 215 μm. Each pair correlation signal was averaged over 12 subregions of dimensions 600 μm × 600 μm, using three identically prepared experimental replicates. The error bars correspond to one standard deviation about the mean (N = 12). All experiments were conducted by initially placing approximately 30,000 cells inside the barrier assay.

