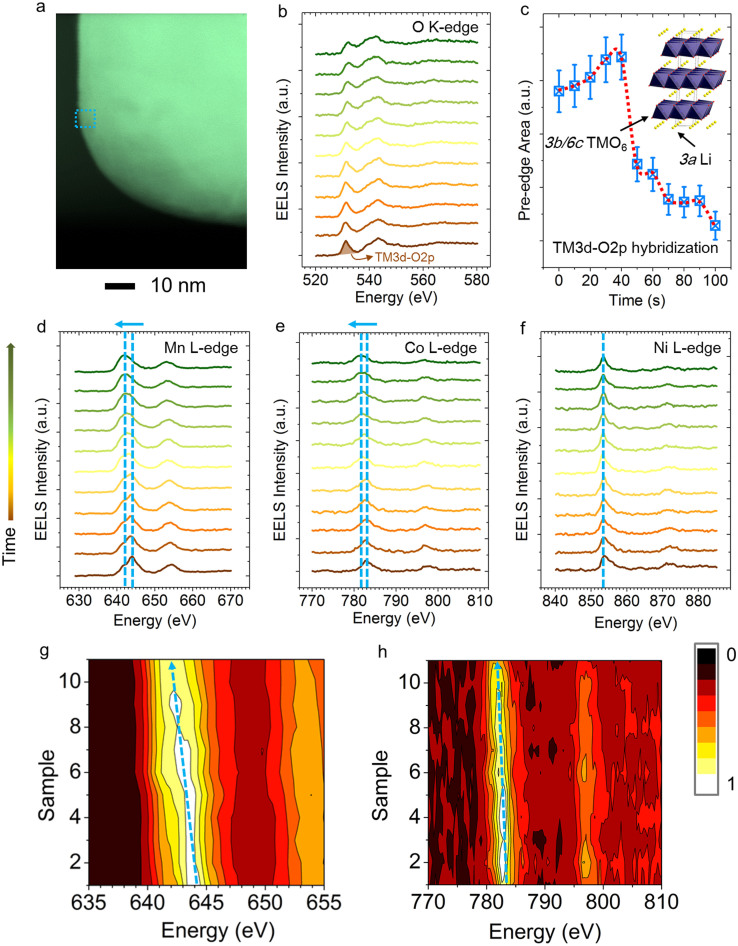
Figure 4. EELS study of an NMC particle using a continuous acquisition mode.
(a) STEM image of the particle with the selected region for EELS data collection. (b) O K-edge EELS spectra. (c) O K-edge pre-edge integrated intensity as a function of electron beam irradiation time. The pre-edge intensity corresponds to TM3d-O2p hybridization states in the 3b sites, as shown in the inset. The integrated pre-edge intensity is in a positive relationship with the oxidation states of TMs in the TMO6 octahedral units. (d–f) TM L-edge spectra corresponding to the O K-edge spectra in (b), where the shifts of L3 peaks are indicated by the dashed lines and arrows. The arrow to the left of (d) indicates the increased exposure time from the bottom to the top in (d), (e) and (f), with an interval of 10 sec. (g, h) 2D EELS maps enhanced for visualization of the peak shifts for Mn (g) and Co (h). Each spectrum was integrated for 10 sec with a dose rate of 113,000 electrons/Å2/sec and an accumulated dose of 1,130,000 electrons/Å2. It shows that the critical dose limit for NMC material is approximately 6,000,000 electrons/Å2, which is four orders of magnitude higher than that of lithium carbonate.

