Figure 1.

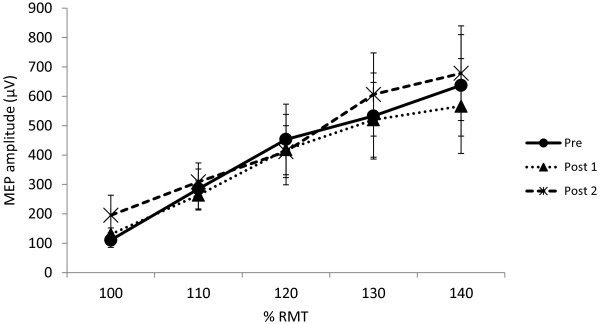
Recruitment curves before and after exercise. Stimulus–response curves pre- and post-exercise in response to stimulation at increasing percentages of RMT (n = 12). Bars represent SEM. (* = p < 0.05).

Recruitment curves before and after exercise. Stimulus–response curves pre- and post-exercise in response to stimulation at increasing percentages of RMT (n = 12). Bars represent SEM. (* = p < 0.05).