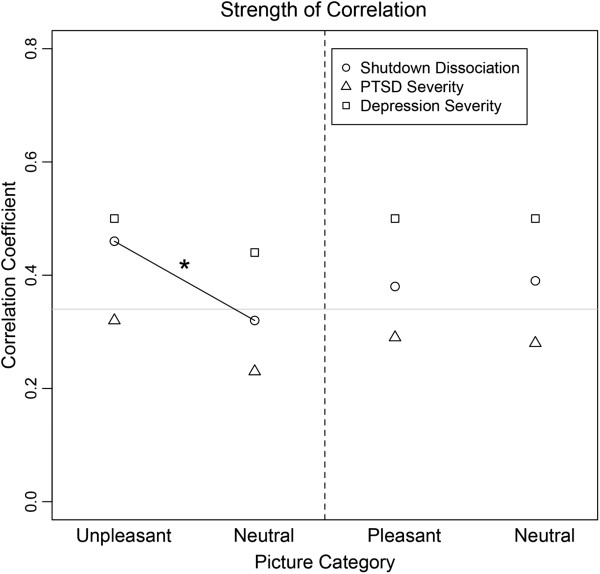
Figure 3.

This figure presents the Pearson correlation coefficient between the surface minimum-norm estimate in source space and the psychopathological scale (circle: Shutdown dissociation; triangle: Posttraumatic Stress Disorder (PTSD) symptom severity; rechtangle: Depression symptom severity) as a function of picture category. The grey horizontal line presents the significance level indicating significant correlations above the line. The dashed line separate the blocks presenting the results of the unpleasant/neutral block at the left side and the results of the pleasant/neutral block at the right side. The black solid line and * indicate the significant difference between the correlation coefficient.
