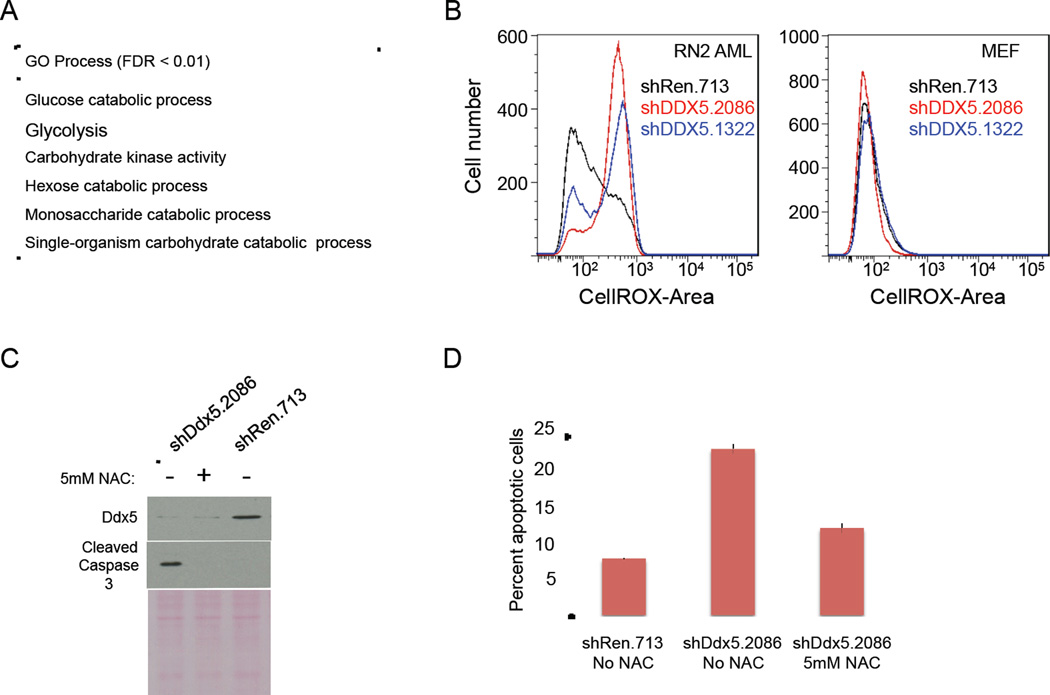
Figure 4. Inhibition of DDX5 expression downregulates the expression of glucose metabolism genes and elevates reactive oxygen species to induce in apoptosis.
(A) Enrichment analysis indicating biological processes enriched for genes differentially expressed as a consequence of DDX5 knockdown in AML cells. Only pathways scoring with an FDR<0.01 in this analysis are shown. (B) Flow cytometry analysis of levels of ROS in AML (left plot) or MEF (right plot) cells +/− DDX5 knockdown using a ROS-activated fluorescent compound (CellROX – BD Biosciences). The black line shows results for cells expressing the control shRen.713 shRNA, the red line shows results for cells expressing the shDDX5.2086 shRNA, and the blue line shows results for cells expressing the shDDX5.1322 shRNA. (C) Immuno-blot analysis of RN2 WCE’s +/− DDX5 knockdown either treated or untreated with 5mM NAC. (D) Flow cytometry analysis of apoptotic cells (Annexin V positive) in AML cell cultures +/− DDX5 knockdown +/− 5mM NAC. Data is presented as the mean from triplicate samples with standard deviations shown.

