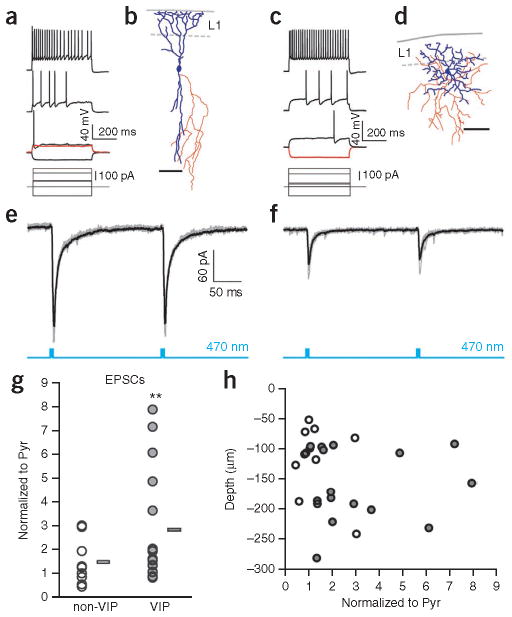
Figure 2.
VIP interneurons receive the strongest input from vM1. (a,c) Representative firing patterns of an irregular spiking neuron (a, VIP-positive 5HT3aR interneuron) and a late spiking neuron (c, non-VIP, 5HT3aR interneuron) produced by increasing step current injections (500 ms) in current-clamp mode. (b,d) Examples of morphologies of the irregular-spiking (b) and late-spiking (d) interneurons reconstructed using Neurolucida tracing. Dendrite and soma are shown in blue and axon in red. Scale bars represent 100 μm. (e,f) EPSCs evoked by photo-stimulation of vM1 axons, recorded in the irregular-spiking neuron (e) and the late-spiking neuron (f). Blue traces indicate photo-stimulation (LED, 470 nm, 5 ms) delivered at 5 Hz. (g) VIP interneurons received significantly stronger vM1 inputs compared with non-VIP interneurons in the 5HT3aR population. EPSCs of VIP and non-VIP interneurons were normalized to simultaneously recorded nearby pyramidal neurons. Bars indicate mean value (VIP interneurons: 15 cells, 12 slices, 8 mice, VIP to pyramidal ratio, P < 0.001; non-VIP interneurons: 10 cells, 7 slices, 6 mice, non-VIP to pyramidal ratio, P = 0.51). **P < 0.005, Wilcoxon signed-rank test. (h) We found no relationship between the recording depth (relative to pial surface) and the strength of the vM1 input. Recording depth is plotted against normalized EPSC. White circles represent non-VIP interneurons and gray circles represent VIP interneurons (correlation coefficient: non-VIP, r2 = 0.078; VIP, r2 = 0.001).

