Figure 4.
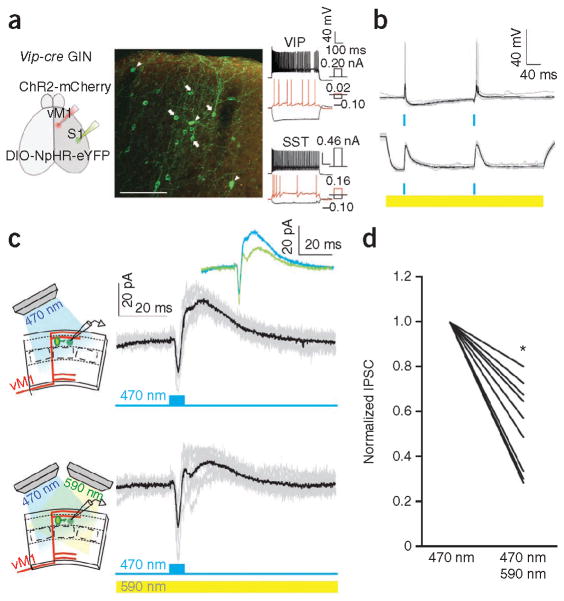
VIP interneurons mediate disynaptic feedforward inhibition of SST interneurons following vM1 activation. (a) Specific expression of NpHR-eYFP in VIP interneurons. AAV-ChR2-mCherry was injected to vM1 and AAV-DIO-NpHR-eYFP in S1 of a Vip-cre GIN mouse (left). Middle, expression of NpHR-eYFP in VIP interneurons in S1. NpHR-eYFP–expressing VIP interneurons (arrow) were easily distinguishable from GIN neurons (arrowhead) as a result of the preferential labeling of the periphery of the cells resulting from membrane expression of eYFP in VIP interneurons. Note the mCherry-expressing vM1 axons in layer 1 of S1. Scale bar represents 100 μm. Right, firing patterns of a NpHR-eYFP–expressing VIP interneuron and a GIN interneuron. (b) Activation of NpHR reduced vM1 activation-evoked spikes from NpHR-expressing VIP interneurons. Photo-stimulation of vM1 axons (blue light, 470 nm) elicited reliable spikes from a VIP interneuron in S1 (top). Photo-stimulation (yellow light, 590 nm) of NpHR sufficiently hyperpolarized the VIP interneuron such that simultaneous photo-stimulation (blue light, 470 nm) of ChR2-expressing vM1 axons evoked only subthreshold EPSPs in the VIP interneuron (bottom). (c) VIP interneurons mediated disynaptic feedforward inhibition of SST interneurons during vM1 activation. Left, schematic of slice recording and photo-stimulation configuration. Right, evoked EPSCs followed by IPSCs recorded from a SST interneuron to blue light (top) and blue light combined with yellow light (bottom). Inset, overlay of averaged postsynaptic currents traces to blue light only (blue trace) and blue light combined with yellow light (green). Gray traces represent individual sweeps, and black traces show the average. Evoked synaptic currents were recorded at −55 mV in voltage-clamp mode. (d) Population data from c. Blue and yellow light stimulation–evoked total IPSC charge was normalized to blue light only stimulation–evoked response in SST interneurons (9 cells, 6 slices, 3 mice; 470 nm + 590 nm to 470 nm ratio, charge P = 0.008). *P < 0.05, Wilcoxon signed-rank test.

