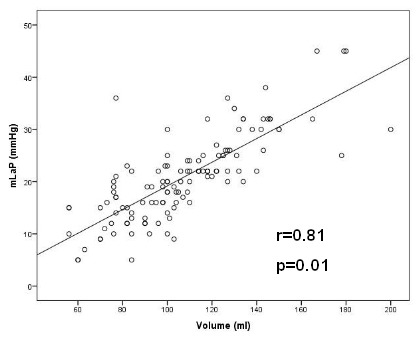
Figure 3.

Linear regression model between the LAV (ml) on X-axis and the mLAP (mmHg) on Y-axis. Pearsons r is 0.81 (p=0.01). Whereas the other two pressure parameters did not show sufficient linear correlation to the LAV. There was also a linear correlation between persistent AF and mLAP (p=0.034; r=0.19; Figure 4).
