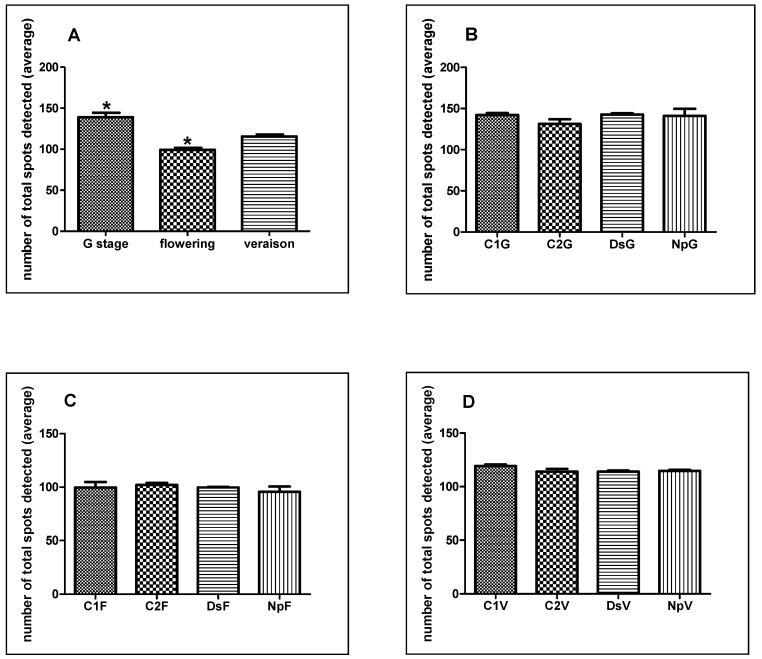
Figure 2.
Number of total spots detected on 2D gels from G stage, flowering and veraison including means (mean of three biological replicates) from all the groups in each stage (A); Number of total spots detected on 2D gels of each group from G stage (B); flowering (C) and veraison (D). Differences among the means were evaluated by the Dunn’s Multiple Comparison Test after that the null hypothesis (equal means) was rejected in the Kruskal-Wallis test, assuming a significance of p ≤ 0.05. Statistically significant differences between two conditions are indicated by an asterisk.

