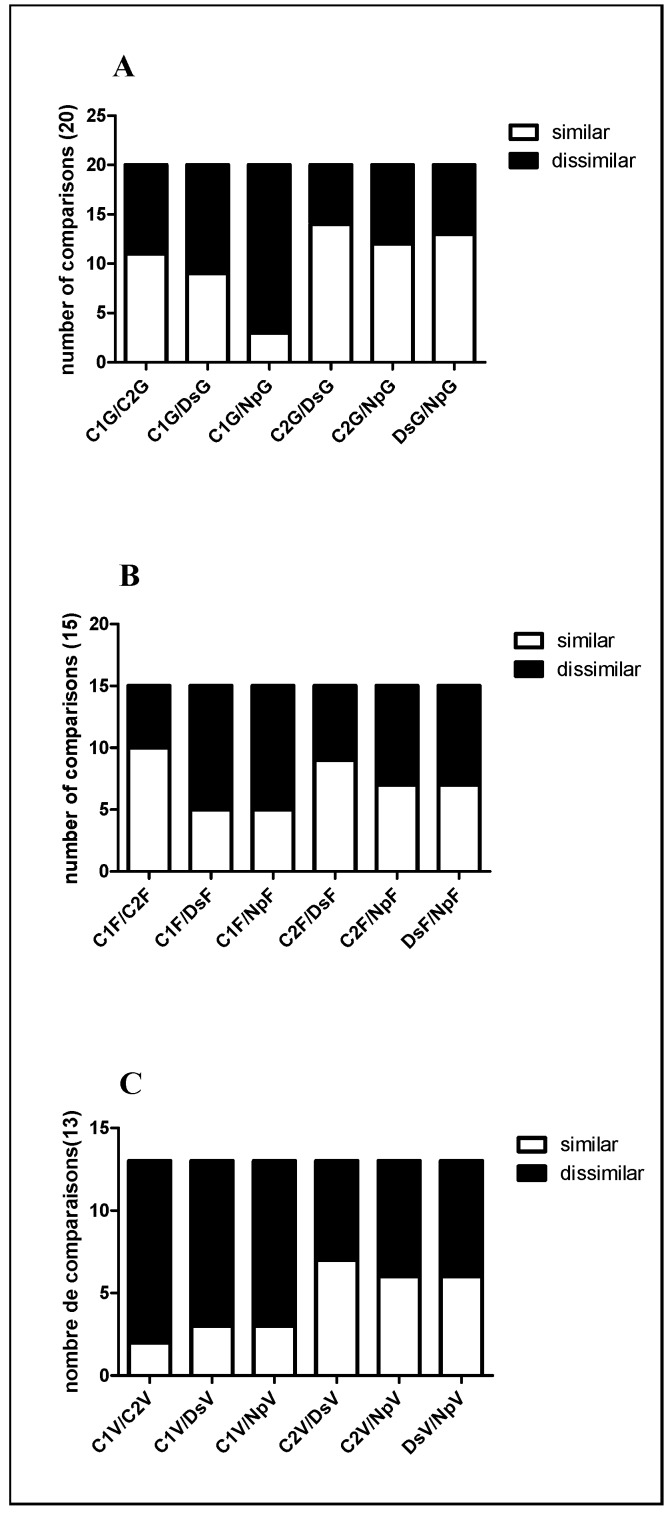
Figure 4.
Pairwise comparison for all the possible pairs of group samples in one spot performed for all the identified spots in each stage. G stage (A); flowering (B), veraison (C). The number of spots where their relative expression was considered to be similar (ratio ≤ |2|) or dissimilar (ratio ≥ |2|) is reported.

