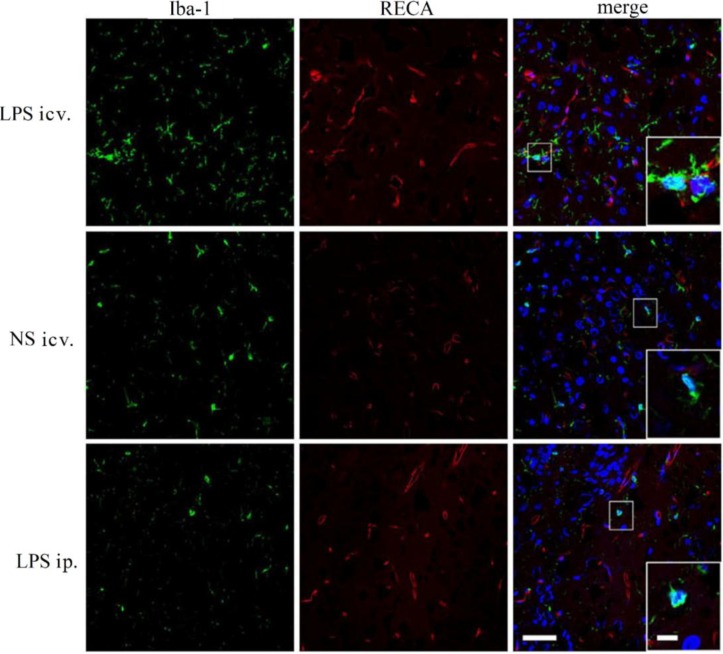
Figure 7.
Representative micrographs of immunofluorescent labeling for Iba-1 (green) and RECA (red) in the brains of the rat at P1. In the central LPS injection group, Iba-1 positively labeled microglial cells distributed more widely than that in the brain (frontal cortex in this figure) treated with ip. injection of LPS or NS. Microglial cells were activated (indicated by large cell bodies and thick processes) while in the brains of rats treated with ip. injectionsof LPS, there were fewer Iba-1 positively labeled cells and these cells remained in the resting state (indicated by their cell bodies and processes), similar to those in the NS-treated brain. RECA immunolabeling revealed no significant difference in the morphology and distribution of the capillaries among these three groups. Amplified boxes were inserted in the merged pictures. Bar outside the box for all the images, 50 µm; Bar inside the box for all the insertions, 10 µm.

