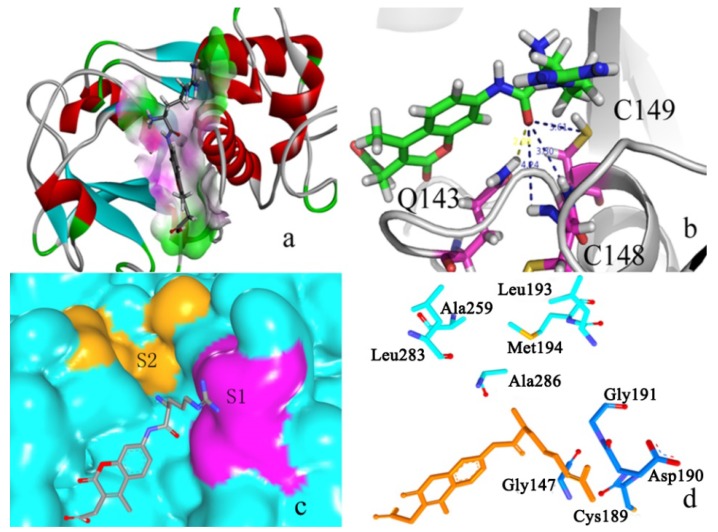
Figure 7.
(a) R-AMC in the active binding pocket calculated by Discovery studio client 3.5 (Accelrys, San Diego, CA, USA); (b) The hydrogen bonds among the R-AMC and the active residues; (c) Surface representation of the substrate binding sites of R-AMC; (d) The active sites of R-AMC. Light blue color represents S2 pocket residues; dark blue color represents S1 pocket residues; orange color represents R-AMC.

