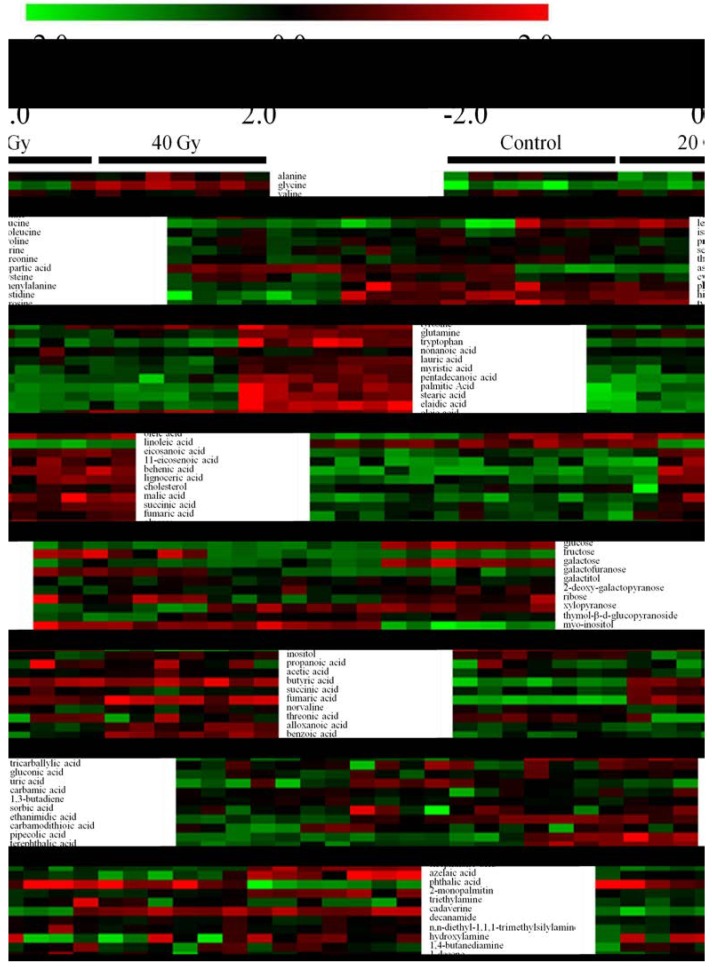
Figure 2.
Heat map representation of the unsupervised hierarchical clustering of 98 metabolites across the non-irradiated and irradiated samples. The sample classes are indicated by the black bars (control = non-irradiated samples, 20 Gy = 20-Gy-irradiated samples, and 40 Gy = 40-Gy-irradiated samples). The columns represent the individual tissue samples, and the rows refer to distinct metabolites. Increases in the intensities of red and green indicate elevations and decreases, respectively, in the levels of a metabolite relative to the median metabolite expression.

