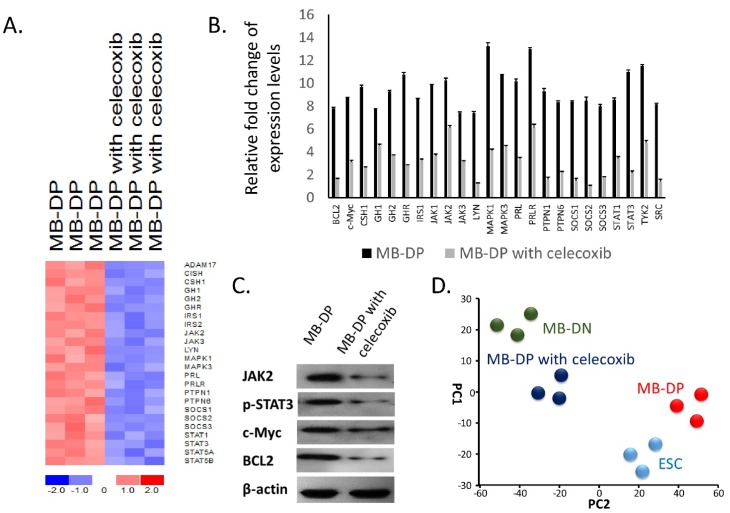
Figure 4.
Celecoxib treatment shifted the gene signature profiles of MB-DPs towards that of MB-DN cells. (A) Heatmap of differential gene expression analysis showing STAT3-JAK3-related genes in MB-DP cells following treatment with celecoxib. STAT3-JAK3-related pathway gene expression levels were altered following treatment with celecoxib. STAT family genes and JAK1 gene were significantly downregulated by such treatment; (B) The data of real-time quantitative PCR show that the STAT3-related genes were highly suppressed in celecoxib treated MB-DPs than control MB-DPs; (C) Western blot showing the downregulation of phosphorylated-STAT3 and STAT3-related protein, JAK2, BCL2, c-Myc in celecoxib treated MB-DPs than control MB-DPs; and (D) Principle component analysis (PCA) illustrating the distances among MB-DP cells, celecoxib-treated MB-DP cells, MB-DN cells and embryonic stem cells (ESCs). The PC1 and PC2 axes are statistical units used in information visualization revealing the similarities and dissimilarities between the subjects.

