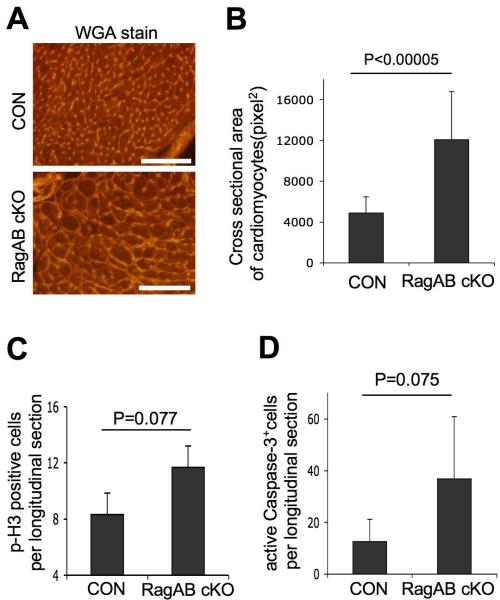
Figure 2. Cardiac hypertrophy in RagA/B cKO mice.
(A) Images of wheat germ agglutinin (WGA)-stained heart tissues. Representative images from control and RagA/B cKO tissues are shown. Scale bars, 100 μm. (B) Cross sectional area of cardiomyocytes. The area of cardiomyocytes from (A) was measured using the ImageJ software. Values represent the mean ± SD of data (n=15 per group). (C) Quantification of cell proliferation in heart tissues. Longitudinal sections of whole mount of hearts were stained with phsopho-Histone3 (p-H3) antibody to detect proliferating cardiomyocytes. The p-H3 positive cells in a whole longitudinal tissue section were counted. Values represent the mean ± SD of data (n=3 per group). (D) Quantification of apoptotic cell death in heart tissue. The serial sections of tissues from (C) were examined for apoptotic cell death by immunohistochemical staining using antibody that binds to cleaved (active) caspase-3. The active caspase-3 positive cells in a whole longitudinal tissue section were counted. Values represent the mean ± SD of data (n=5 per group). P values were determined by Wilcoxon rank sum test.

