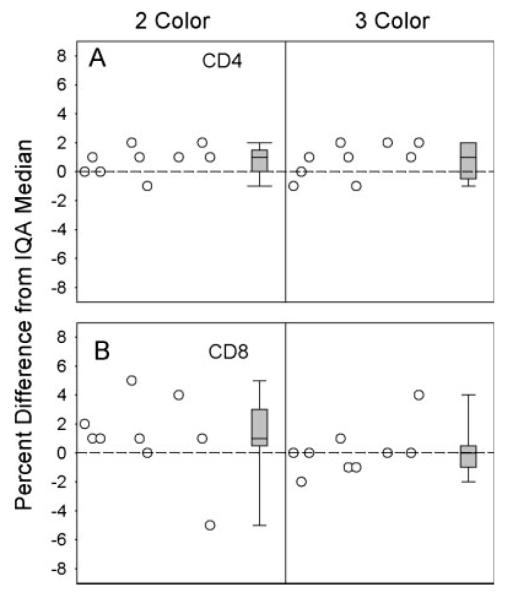
Fig. 3.
Distributions of differences between the CD4+ (A) and CD8+ (B) T-cell percentages obtained by site 3 and the IQA medians on individual specimens. Plots are from a paired analysis showing results from the 2-color method on the left and results from the 3-color method on the right side of each plot. Both individual values and box plots (defined as in the legend to Fig. 2) are shown. The nine samples include nonreplicates and only the first of the replicates as labeled by the IQA. The plots show improved IQA performance for CD8 for the 3-color method.

