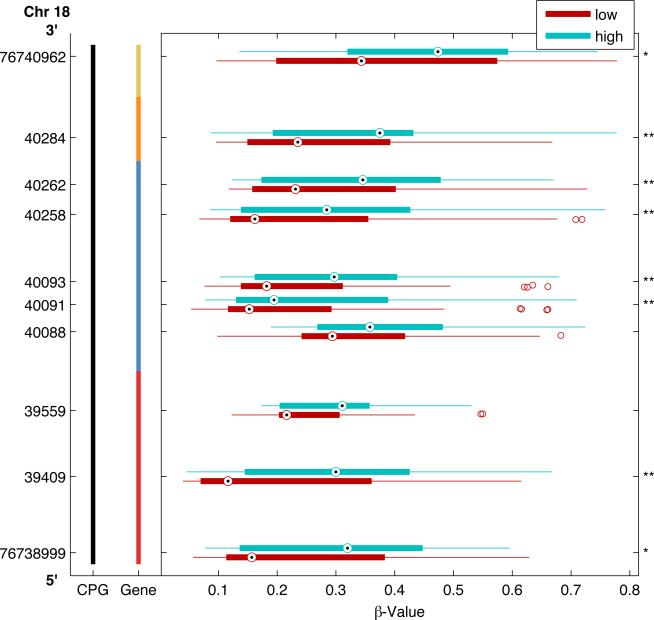
Figure 3.
Differentially methylated CpG Loci by clinical risk group across genomic regions of the SAL-Like 3 (SALL3) gene. A representative region of the genome from chromosome 18 (Chr 18) encoding the SALL3 gene is presented spanning 2Kb from 3’ (top) to 5’ (bottom) with genomic coordinates on vertical axis. This region includes 10 CpG loci within a CpG island (black bar) located 200 bp (red) and 1500 bp (blue vertical bar) from the gene transcriptional start site or within the first exon (orange) or body (mustard) of the gene. For each CpG loci, boxplots illustrate the median (dot) and interquartile range [25th (low boundary of box) and 75th (upper boundary of box) percentiles] of β-values in high (aqua blue boxes) and low-risk (maroon red boxes) tumors. Significantly different median methylation at each CpG loci is noted: * p<0.05; ** p<0.01.

