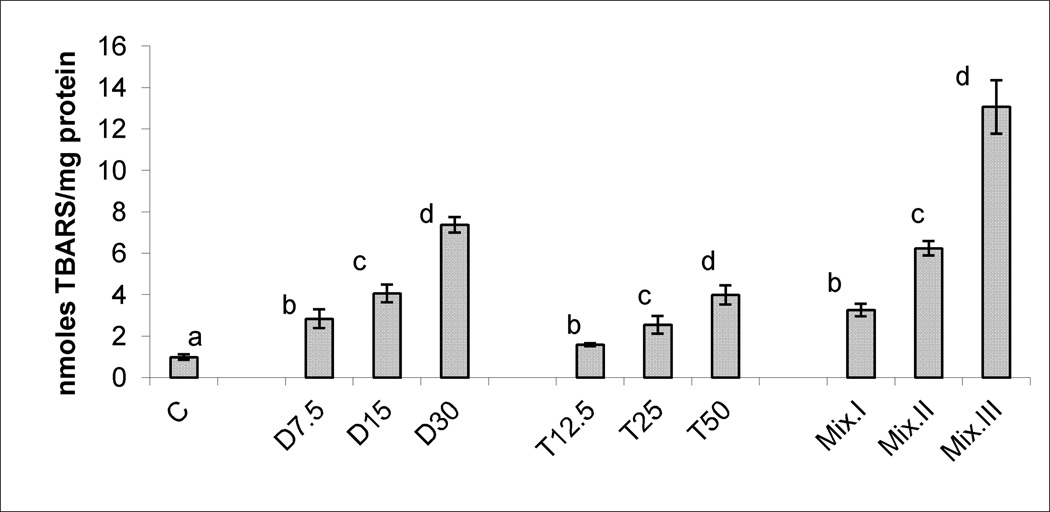
Figure 2.
LP, indicated by TBARS production in the livers of mice treated subchronically with 7.5, 15 and 30 mg DCA/kg/day, 12.5, 25 and 50 mg TCA/kg/day, and mixture I, II and III of DCA/TCA ratios that correspond to 7.5/12.5, 15/25 and 30/50 mg/kg/day, respectively. Columns with non identical superscript are significantly different (p<0.05) when compared against each other and also against the control.

