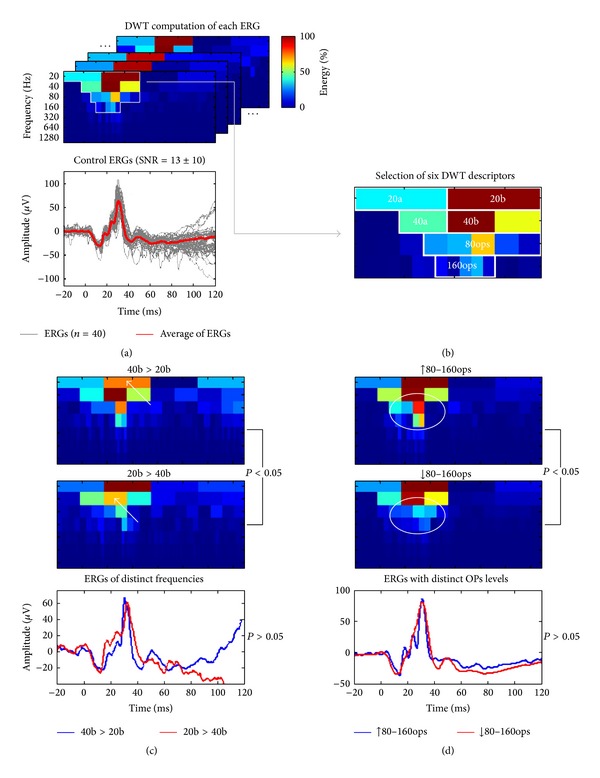
Figure 3.

Analysis method and classification improvement of normal ERGs using the discrete wavelet transform (DWT). (a) We computed the DWT of 40 normal ERGs with various signal-to-noise ratios (SNR = 13 ± 10, gray traces; averaged response: red trace) and extracted, in each scalogram, descriptors (see panel (b)) localized inside the region of maximal energy (delimited by white borders). (b) Magnification of the averaged ERG (red trace at panel (a)) scalogram that shows where we identified six novel DWT descriptors of the ERGs (20a and 40a: a-wave energy; 20b and 40b: b-wave energy; and 80ops and 160ops: oscillatory potentials (OPs) energy). ((c) and (d)) The DWT descriptors were used to segregate ERGs of distinct morphologies, that had similar (P > 0.05) a- and b-wave amplitudes and peak times but significantly (P < 0.05) smaller 20b or 40b descriptors (panel (c), white arrows) or significantly larger or smaller 80ops and 160ops descriptors in the DWT scalograms (panel (d), white circles).
