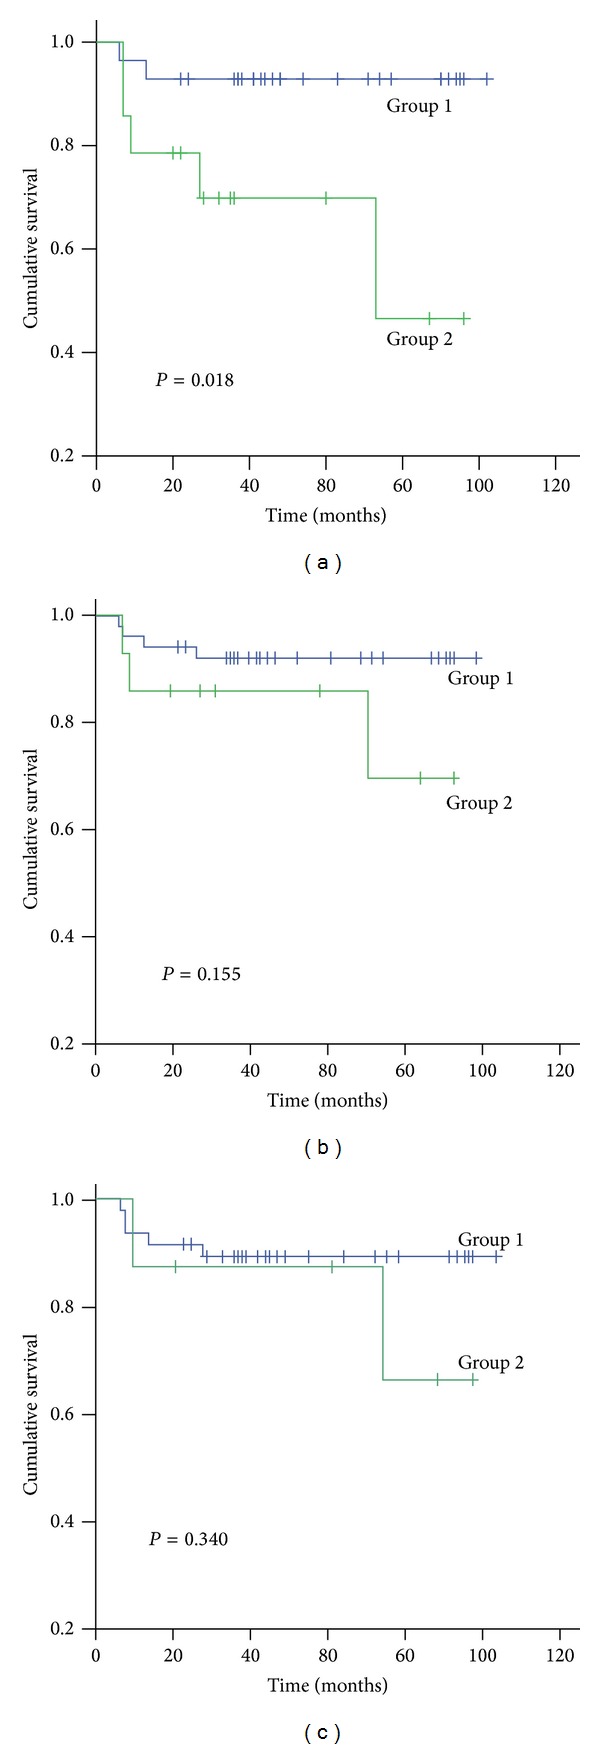
Figure 4.

Effect of different cutoff values on cumulative survival rate for stage II PDCRC patients. Group 1 refers to the cases with Syn- and/or CgA-positive cells below the cutoff value while Group 2 refers to the cases above the cutoff value. (a) Kaplan-Meier survival analysis showed that, for a cutoff value of one Syn- and/or CgA-positive tumor cell/HPF, the survival of Group 1 patients was greater than that of Group 2 patients (P = 0.018). When the cutoff value was 10 (b) or 20 (c) Syn- and/or CgA-positive tumor cells/HPF, there was no survival difference between the groups (P = 0.155 and P = 0.340, resp.).
