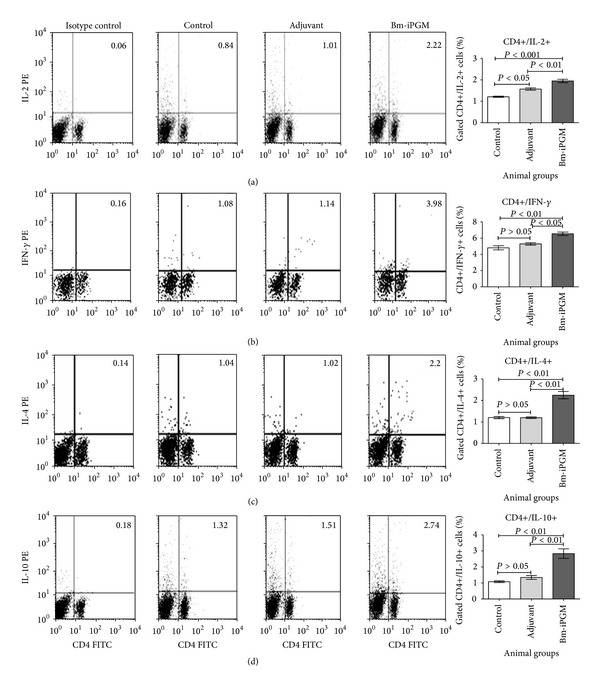
Figure 8.

Flow cytometric analysis of intracellular IL-2, IFN-γ, IL-10, and IL-4 production in CD4+ T cells. Splenocytes were stained and processed as described in Section 2. Numbers in the upper right quadrant of dot plot represent the mean percentage of CD4+ T cells positive for (a) IL-2, (b) IFN-γ, (c) IL-4, and (d) IL-10 in particular group. Bar graph was generated for percentage of CD4+ T cells positive for IL-2, IFN-γ, IL-4, and IL-10. Statistical significance of the differences between mean values of immunized and control groups is depicted as *P < 0.05; **P < 0.01; and ***P < 0.001.
