
Figure 6.
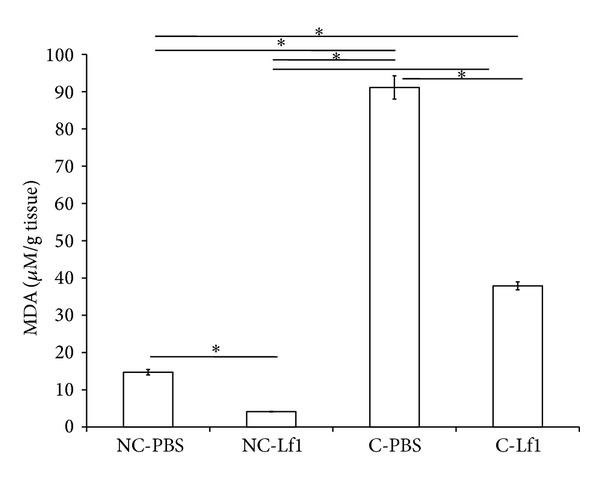
Comparative evaluation of MDA levels recorded in the colonic tissue of experimental mice group for different treatments. NC-PBS: noncolitis control; NC-Lf1: noncolitis (Lf1) control; C-PBS: colitis control; and C-Lf1: colitis-Lf1 treatment groups. *Data are significantly different within the group (P < 0.001, Bonferroni post hoc test). The data for different groups were reported as mean ± standard deviation.