
Figure 7.
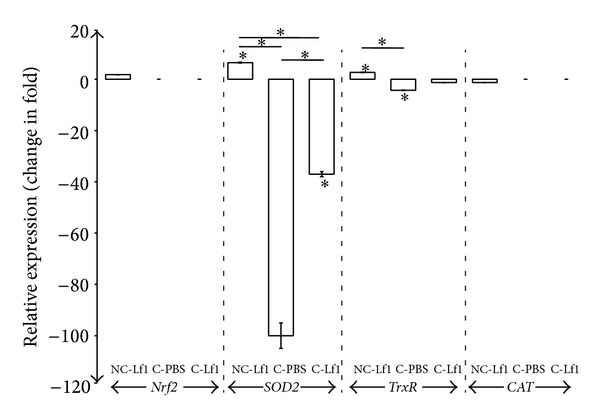
Relative expression of Nrf2, SOD2, TrxR, and CAT in colitis mouse model. NC-Lf1: noncolitis (Lf1) control; C-PBS: colitis control; and C-Lf1: colitis-Lf1 treatment groups. Data are represented as mean ± SD; number of RT-qPCR experiments (n) = 3. Data showing asterisk mark (∗) without line shows significant difference compared with noncolitis control (Bonferroni post hoc test); *P < 0.001.