Figure 6.
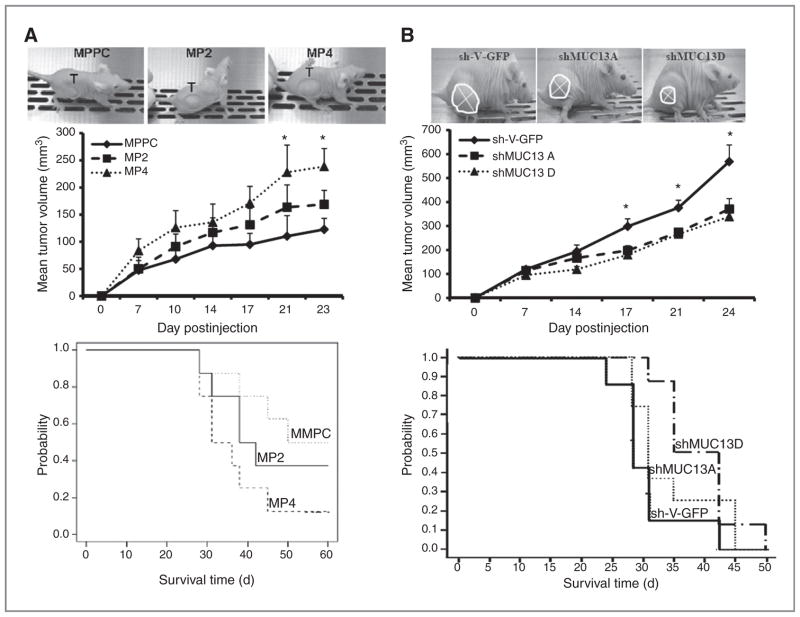
MUC13 expression alters in vivo tumorigenesis and survival in nude mice xenograft model. A, top, photographs of mice with tumors from MiaPaca-derived MUC13 expressing (MP2 and MP4) and nonexpressing vector control (MPPC) cells. Tumors are circled and the graph shows the average tumor volume on days postinjections. Mean of at least 8 mice/group. Mean ± SE; *, P < 0.05. Bottom. Kaplan–Meier plot showing survival of mice injected with MiaPaca-derived cells. B, top, photographs of tumors established with MUC13 knockdown HPAFII (shMUC13A and shMUC13D) and scrambled sh-vector control (sh-V-GFP). Tumors are circled and the graph shows the average tumor volume on days post injection. Mean of at least 8 mice/group. Mean ± SE; *, P < 0.05. Bottom, Kaplan–Meier plot showing survival of mice injected with HPAFII-derived cells.

