
Figure 3.
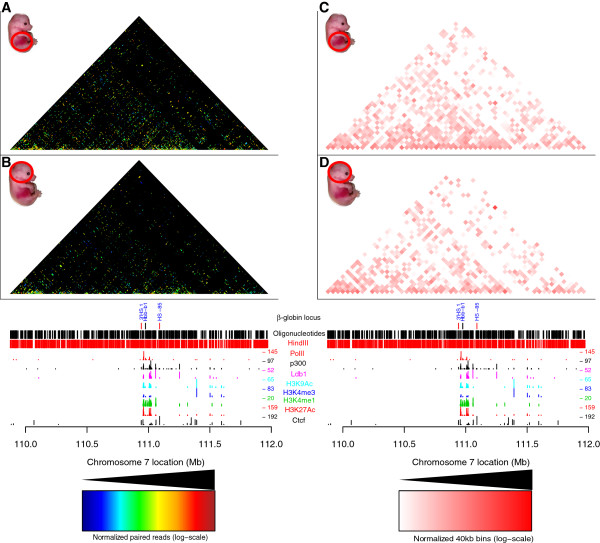
Comparison of the compartmentalization and interactions for the β-globin locus. T2C performed in a 2.1 Mb region around the β-globin locus for mouse primary erythroid cells (A) and mouse fetal brain cells (B) from E12.5 mice. The topological domain patterns between different biological materials are identical and are independent of the number of interactions. Analysis of the interactions obtained with T2C obtained from mouse primary erythroid cells (C) and mouse fetal brain cells (D) were plotted at 40 kbp resolution to compare T2C to the regular Hi-C binning. The overall topological domain pattern is similar in the two tissues. All the T2C interactions are normalized to the same color code (see color inset). The bottom tracks show a linear representation of the β-globin locus, the oligonucleotides probes positions (black lines), HindIII recognition sites (red lines) and the ChIP-seq derived binding sites of PolII (red lines), Ldb1 (purple lines) [38], Ctcf (black lines), p300 (black lines), and various histone modification markers (light blue, dark blue, green, and red) [37] in mouse erythroleukemia cells.