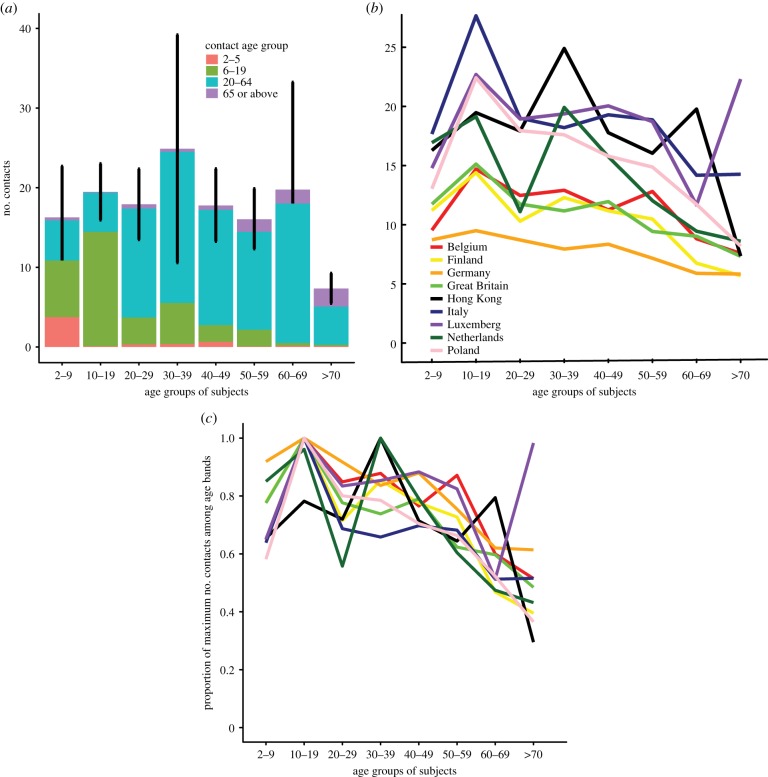
Figure 1.
Age-specific contact patterns. (a) Distribution of self-reported contacts by age group for the present study. Values are the average per participant of the midpoint between reported maximum and minimum. Vertical black lines indicate binomial confidence bounds for the number of contacts across all four contact age classes for each participant age group. (b) Comparison of total number of contacts per age group for eight European countries, as reported in the PolyMod study [8]. PolyMod reported both participants and contacts in 5 year age groups starting with 0–4 years. Therefore, other than for the lowest age class, we used linear interpolation to generate consistent age boundaries from our less detailed data. For the lowest age class of participants, we report a range of 2–4 years, because our youngest participant was 2 years old. We assumed that PolyMod recruited few 0 and 1 year olds, so we did not interpolate for the lowest participant age class. We did not ask participants to report their contacts in 5 year age groups. (c) Also compares total contacts between the present study and the PolyMod study. However, in (c), although the relative amplitude for each age group for individual populations has been preserved, the amplitude has been rescaled, so that the maximum value for each country for any age group is 1.

