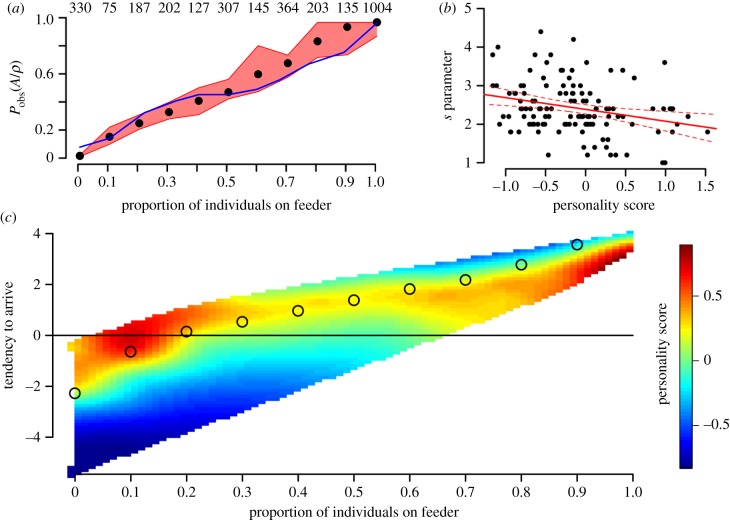
Figure 1.
(a) Collective behaviour of focal individuals in the population, with birds arriving more often to high-density sites and less often to low-density sites than expected. The y-axis is observed probability of arriving, given the density of individuals at the feeder (see equation (2.1)). The red envelope represents maximal range of data from 1000 jack-knife randomizations with 40% of data removed. The blue line is the result of 20 000 simulated arrivals using model with social attraction parameter s = 1.93. Numbers represent observed arrivals for each density bin. (b) Relationship between-individual personality score (slow-explorer, SE to fast-explorer, FE) and social attraction s with 95% CI. (c) Mean personality score with respect to foraging location density from 10 000 simulated arrivals for each value of s. More SE (blue) individuals have a lower tendency to arrive at low densities and a high tendency to arrive at high densities, whereas more FE (red) individuals have less deviation from random feeder choice. Line = 0 represents expected arrivals in the patch based on random feeder choice, open circles are the observed flock-level data from (a), colours are mean personality in simulated data for tendency to arrive at feeders with a given density.

