
Figure 3.
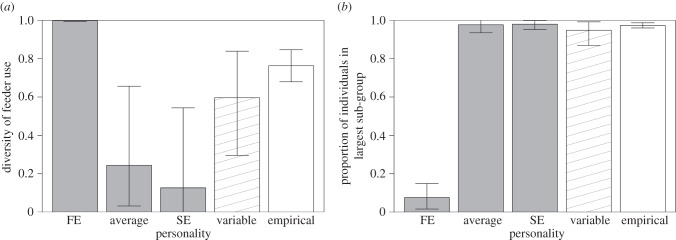
Emergent group behaviour arising from within-group variation in individual personalities, comparing observed data against four sets of simulations. Individuals in simulations were either: all fixed at s-value for most proactive individuals (FE); all fixed at average personality phenotype (average); all fixed at s-value for most reactive individuals (SE); or randomly sampled from within distribution of personality scores (variable). Horizontal bars are 95% range (simulated data) and 95% CI from 20 replicated habitat patches (empirical data). (a) Diversity of feeder use within patches in each simulation type, defined as how evenly all four feeders were used [60]. (b) Proportion of individuals in largest subgroup, representing group cohesion. Results highlight importance of intragroup variation in social information use, as also shown by empirical data.