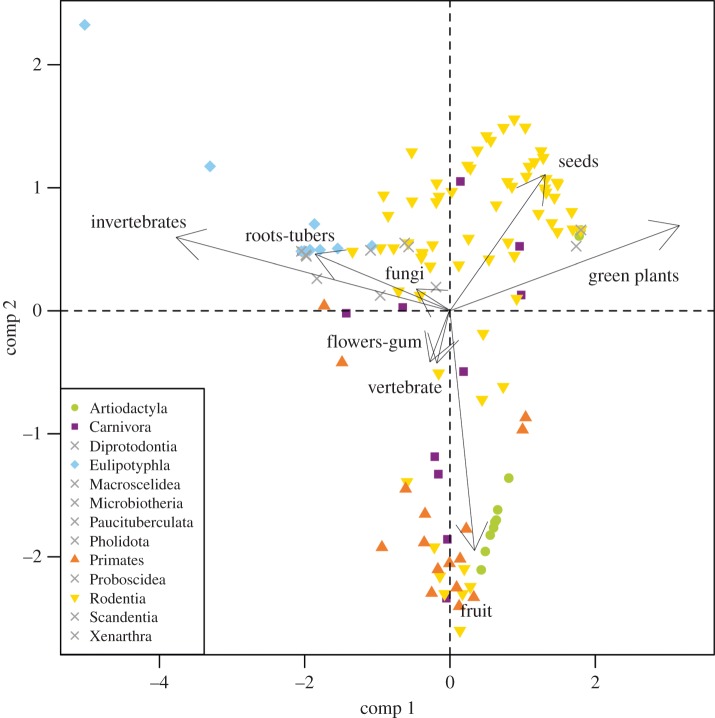
Figure 1.
Scores of the two first components of the principal component analysis of dietary data for all the 139 species in the dataset. Raw data are square-root transformed percentages of food items based on stomach content examinations. Arrows indicate the loadings of the two first components of the analysis. Symbols represent taxonomic orders. Crosses indicate orders each represented by less than three species.

