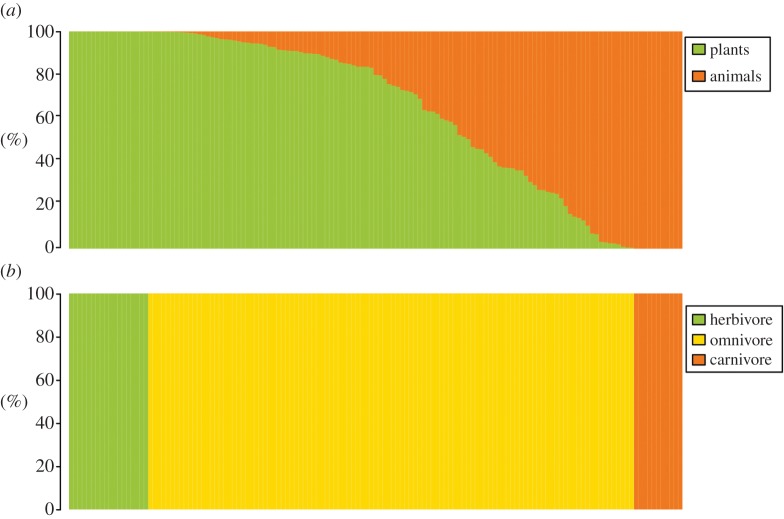
Figure 3.
Dendrograms showing (a) the proportions of plant and animal resources in each species’ diet and (b) feeding classifications based on classic trophic relationships (herbivore–omnivore–carnivore). The 139 species in the dataset are sorted by descending proportions of plant resources in their diets.

