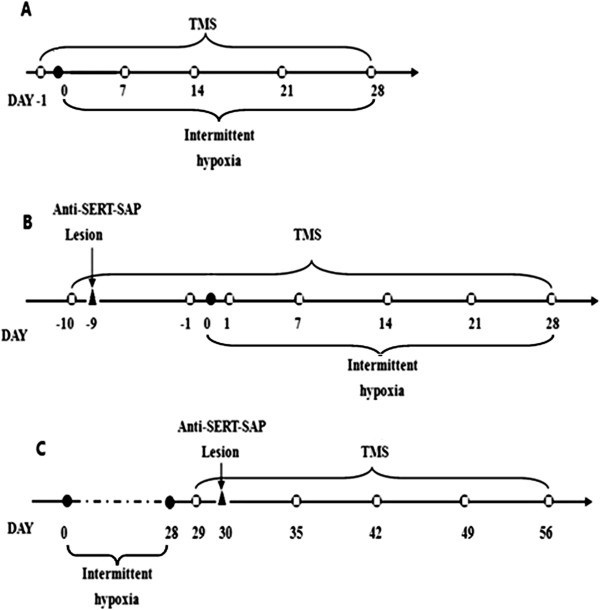
Figure 1.

Schematic diagram of the experimental protocol.  : TMS. Panel A represents the procedure of the first series of experiments, panel B represents the procedure of the second series of experiments, panel C indicates the procedure of the third series of experiments.
