Figure 5.

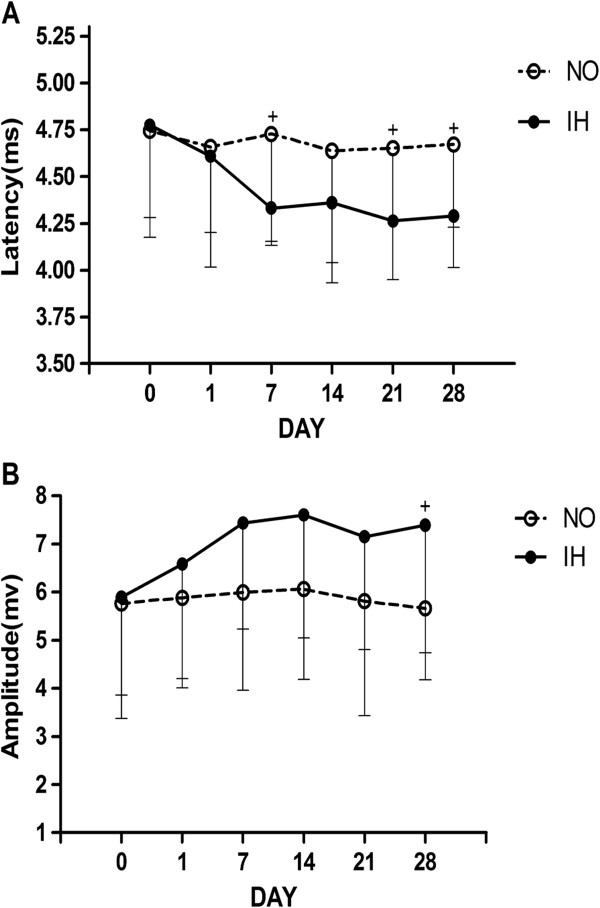
The MEP latency (A) and amplitude (B) of genioglossus in the NO and IH groups. + Indicates a significant difference between the NO and IH groups at the same measurement time (P < 0.05).

The MEP latency (A) and amplitude (B) of genioglossus in the NO and IH groups. + Indicates a significant difference between the NO and IH groups at the same measurement time (P < 0.05).