Figure 2.
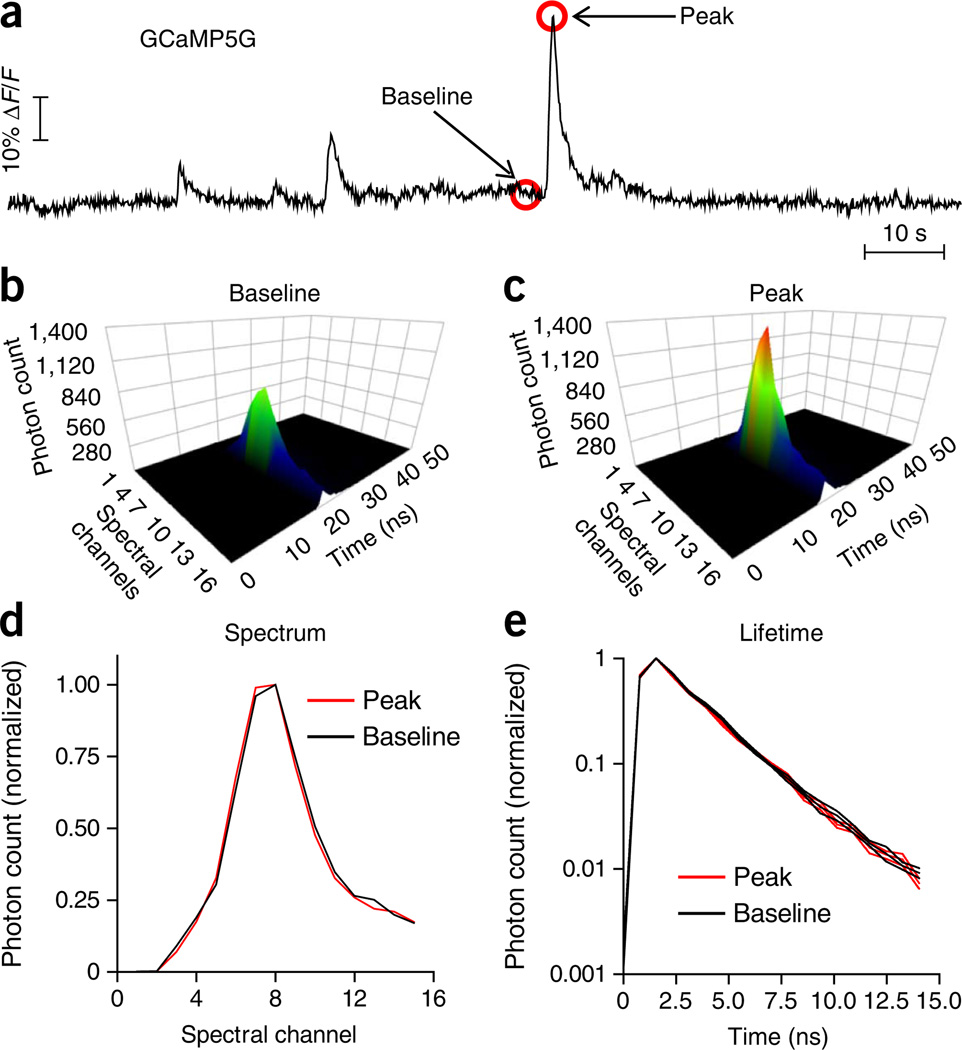
In vivo measurement of GCaMP5G fluorescence using TCSPC-based photometry. (a) An example trace of GCaMP5G fluorescence intensity in the format of ΔF/F over time in a freely moving A2A–Cre mouse expressing GCaMP5G specifically in striatal indirect-pathway SPNs. Fluorescence intensity was calculated by integrating the photon count of peak GCaMP5G spectral channels (channels 6–13) in each time-resolved spectrum (b,c). Individual spectra were acquired at 20 Hz. (b,c) Examples of individual time-resolved GCaMP5G spectra at the baseline level (b) and at the peak of a fluorescence transient (c). (d,e) Normalized GCaMP5G spectra (d) and fluorescence decay curves (e) acquired at the baseline (as in b) and at the peak of a fluorescence transient (as in c). Despite the large difference in fluorescence intensity (b versus c), there is no difference between normalized spectra (d) and fluorescence lifetime (e), consistent with previous studies20. All animal protocols used in this study were approved by the US National Institute on Alcohol Abuse and Alcoholism Animal Care and Use Committee.

