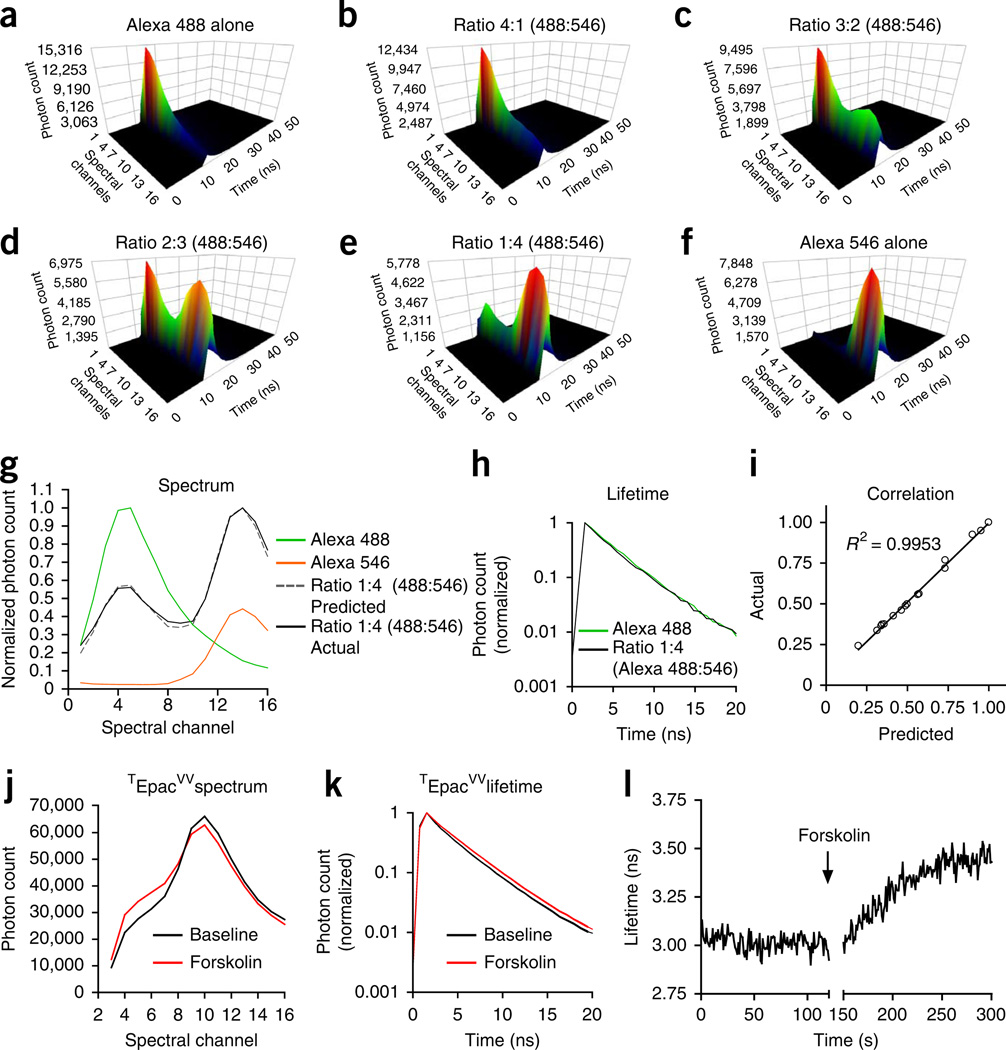
Figure 3.
Potential applications of a TCSPC-based fiber optics system for ratiometric measurement in a dual-fluorophore system and lifetime measurement in FRET-based biosensors. (a–f) Examples of time-resolved spectra measured in solutions containing different volume ratios of Alexa Fluor 488 and Alexa Fluor 546 fluorescent dyes. (g) Normalized spectra of Alexa Fluor 488 (green), Alexa Fluor 546 (orange) and a mixture of Alexa Fluor 488 and Alexa Fluor 546 with the volume ratio of 1:4 (black). The dashed gray trace is a reconstructed spectrum using the equation Y = a × Y1 + b × Y2, where Y1 is the normalized spectrum of Alexa Fluor 488, Y2 is the normalized spectrum of Alexa Fluor 546, a = 0.2 and b = 0.8. (h) Normalized fluorescence decay curve of Alexa Fluor 488 and the 1:4 mixture of Alexa Fluor 488 and Alexa Fluor 546. (i) Goodness of fit to show the reconstructed spectrum (gray in g) and the measured spectrum (black in g) has a nearly perfect match. (j,k) Examples of fluorescence spectra (j) and lifetime (k) acquired from HEK cells expressing FRET-based cAMP sensor TEpacVV before (black) and after (red) adding the adenylyl cyclase activator forskolin (100 µM) into the medium. (l) Continuous measurement of fluorescence lifetime of TEpacVV before and after the addition of forskolin.

