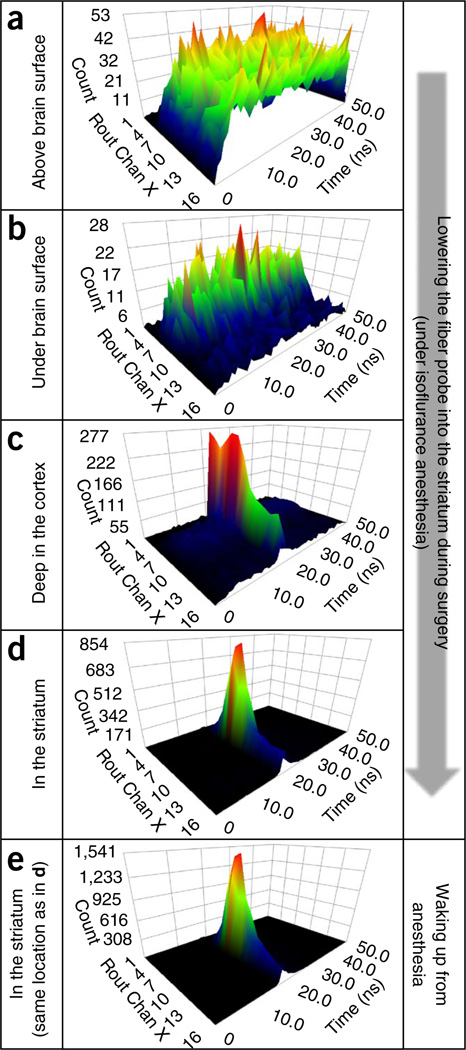
Figure 6.
A series of snapshots of time-resolved spectra acquired during the process of lowering the fiber probe into the striatum. (a) Detected photons are mostly from the ambient light when the fiber probe is placed above the brain surface. (b) The photon count decreases after the tip of the probe is submerged below the brain surface. (c) The laser-excited GCaMP5G spectrum starts to appear while the probe is going down through the cortex. (d) The GCaMP5G spectrum becomes dominant when the tip of the probe is in the dorsal striatum. (e) The intensity of GCaMP5G (measured at the same place as in d) is markedly increased after the animal wakes up from anesthesia (note the peak values highlighted by red dashed ovals). In all time-resolved spectrum plots, the x axis (‘Rout Chan X’) depicts the wavelength channels for detecting the fluorescence spectrum; the y axis depicts the time channels (in ns) for measuring fluorescence decay time; and the z axis is the photon count. All animal protocols used in this study were approved by the US National Institute on Alcohol Abuse and Alcoholism Animal Care and Use Committee.

