Figure 2.

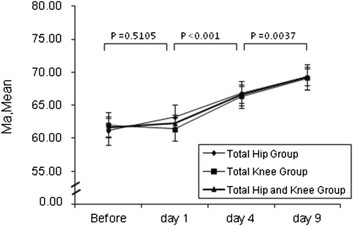
Trends of MA after operation between three groups. I bars indicate the 95% confidence intervals. P value is the comparison between different time points of the total hip and knee group.

Trends of MA after operation between three groups. I bars indicate the 95% confidence intervals. P value is the comparison between different time points of the total hip and knee group.