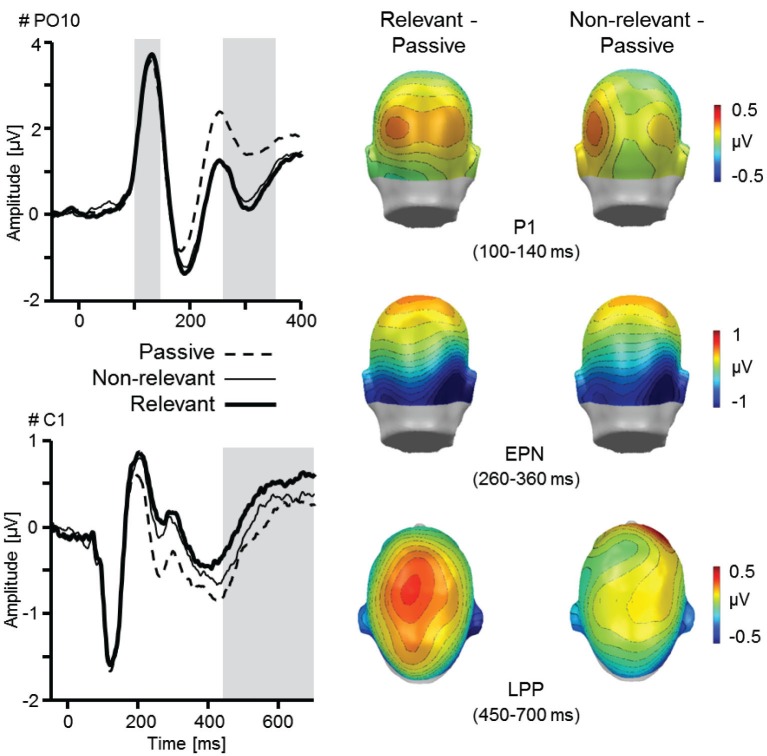
Figure 3.
Illustration of the main effects Task and Relevance as revealed by the P1, EPN, and LPP component. ERP waveforms for an exemplary occipital (PO10) and central sensor (C1) for relevant and non-relevant face stimuli, each compared to the passive viewing condition. Topographical difference maps (relevant–passive, non-relevant–passive) display the averaged time interval plotted on the back of a model head (P1: 100–140 ms; EPN: 260–360 ms) and a top view (LPP: 450–700 ms). Analyzed time windows are highlighted in gray (PO10: P1 and EPN; C1: LPP).

