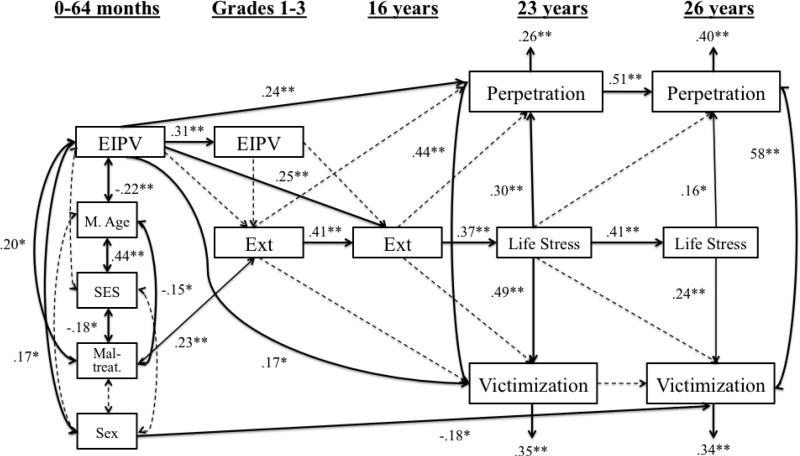
Figure 3.
Note. χ2 (19, 168) = 30.27, p = .05, RMSEA = .06, CFI = .98.
Solid lines represent significant paths; dashed lines represent paths included but not significant. All covariates [child sex, family SES, maternal age (M. Age), and maltreatment] were included on every path. For simplicity, only the interrelations between covariates and any significant paths from them are shown. Maltreatment (Maltreat.) spanned ages 0-17.5 years.
* p < .05, ** p < .01

