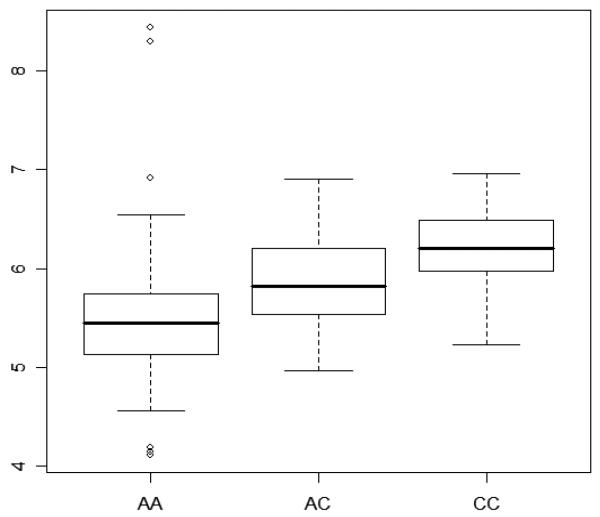
Figure 1.
Box plots showing the complete distribution of F-cells, expressed as 109 F-cells per liter of blood in log scale, on the y-axis among Chinese adult β-thalassemia heterozygotes, excluding those who were heterozygotes for the β-globin gene promoter nt −28 A>G β+-thalassemia mutation and those who were heterozygous for the C>T polymorphism (rs7482144) at the HBG2 promoter nt −158 bp. AA, AC, and CC represent the SNP genotypes at rs766432. Each rectangle shows the data between the 25th and 75th quartiles, and the bar in each rectangle is the median value for the F-cells in log scale.

