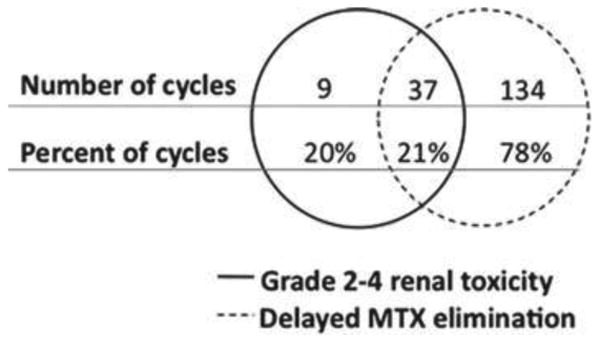
Figure 2.

Venn diagram depicting the relationship between renal toxicity and delayed elimination. Th e diagram is composed of two circles, one indicating grade 2 – 4 renal toxicity and one indicating delayed MTX elimination. Th e space between represents agreement between the two metrics. Values in the left circle represent the number and percent of encounters that fi t grade 2 – 4 renal toxicity but did not fi t delayed MTX elimination criteria. Values in the right circle represent the number and percent of cycles that fi t criteria for delayed MTX elimination but did not fi t the criteria for grade 2 – 4 renal toxicity
