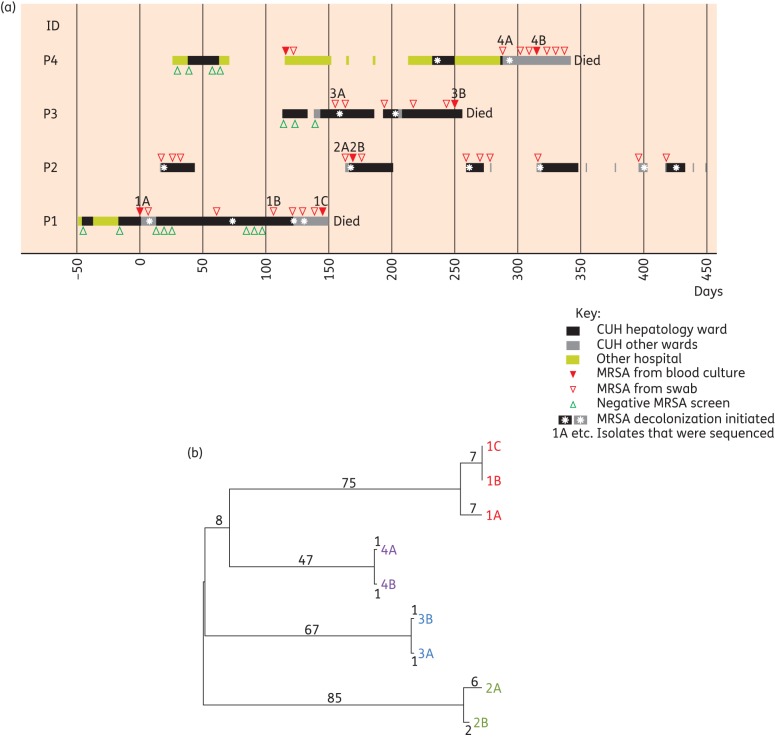
Figure 1.
Epidemiology and bacterial phylogeny of MRSA bacteraemia cases. (a) Epidemiological map of four patients (P1–P4) with MRSA bacteraemia. Each row represents a single patient and the coloured blocks for each represent the time spent as an inpatient on the hepatology ward, other wards at the CUH or at other hospitals. The length of each box denotes the duration of admission and the scale bar represents days after the date of the first bacteraemia. (b) Phylogenetic tree based on whole-genome sequencing of nine carriage and bacteraemia isolates of MRSA from the four patients shown in (a). The numbers shown represent SNP differences between isolates.

