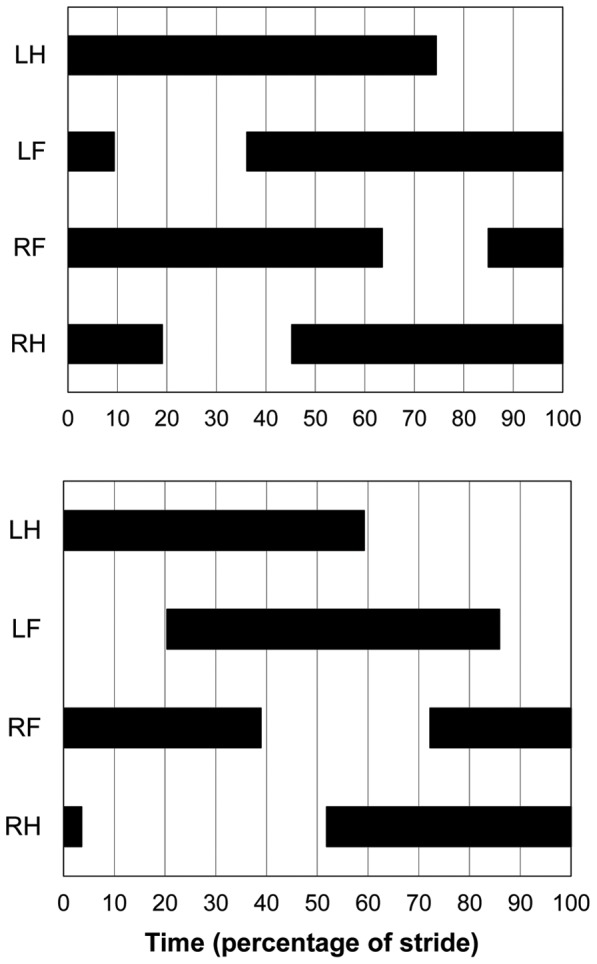
Figure 2. Representative footfall sequences in Participant 1 (Family “A”).

Above, lateral sequence, diagonal couplets (limb phase = 0.36, mean duty factor = 0.75); below, lateral sequence, lateral couplets (limb phase = 0.20, mean duty factor = 0.61) Black bars represent the period of substrate contact for each limb (LH: left hind limb; LF: left forelimb; RF: right forelimb; RH: right hind limb).
