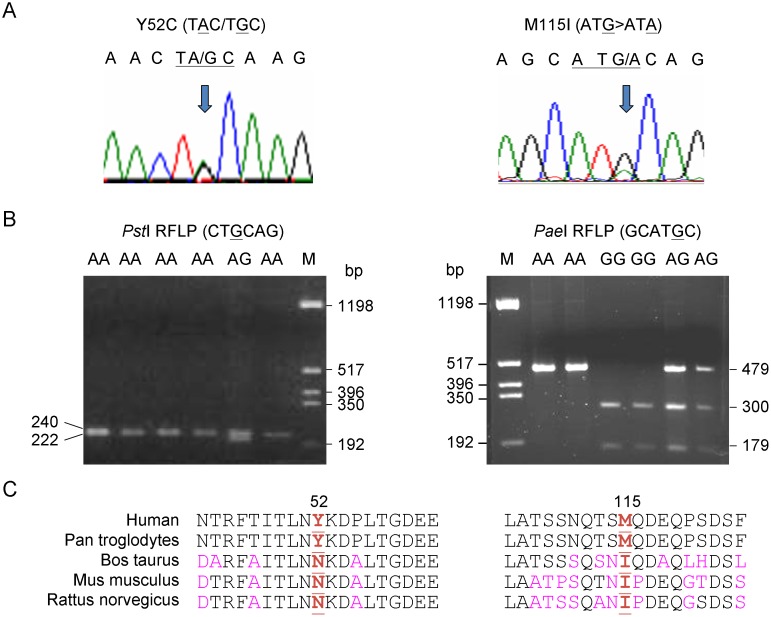
Figure 1. Variant identification and amino acid sequence alignment.
(A) Chromatograms of direct cDNA sequencing of Y52C and M115I. (B) Restriction analysis of Y52C and M115I. On agarose gel, Y52C creates new PstI restriction site by mismatch PCR and leads to an additional 222 bp band, whereas M115I loses restriction by PaeI and leads to 479 bp band. (C) Evolutionary conservation of the regions of FBXO7 Y52C and M115I using the program Vector NTI.

