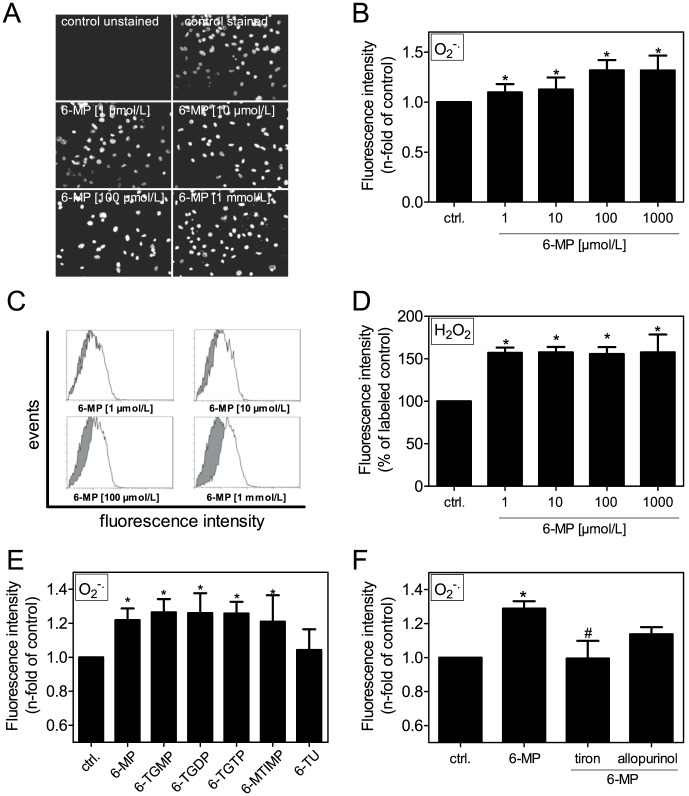
Figure 4. Involvement of ROS.
(A,B,E,F) VSMCs were stimulated as indicated for 30 min before labeling cells with DHE. Superoxide production was (A) visualized via fluorescence microscopy (representative images from 3 independent experiments) or (B,E,F) quantified in a fluorescence plate reader (n≥6). (C,D) Hydrogen peroxide production is measured in H2DCFDA-labeled cells via flow cytometry. (C) Representative histograms of flow data (grey: control, white: 6-MP). (D) Quantification of fluorescence intensity by % of labeled control (n≥6). (E) Stimulation with 6-MP (100 µmol/L) or its metabolites (each 10 µmol/L). (F) Stimulation with 6-MP (100 µmol/L) alone or costimulation with inhibitors (tiron [1 mmol/L] and allopurinol [1 µmol/L]). DHE: dihydroethidium, 6-MP: 6-mercaptopurine, 6-MTIMP: 6-methylthioinosine monophosphate, 6-TGDP: 6-thioguanosine diphosphate, 6-TGMP: 6-thioguanosine monophosphate, 6-TGN: 6-thioguanine nucleotide, 6-TGTP: 6-thioguanosine triphosphate, 6-TU: 6-thiouric acid.

