
Figure 1. (Subway) Relationship between ridership and coverage.
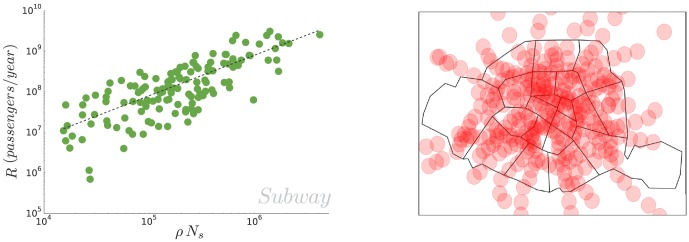
(Left) We plot the total yearly ridership  as a function of
  . A linear fit on the
  data points gives
  (
( ) which leads to a typical effective length of attraction
  per station. (Right) Map of Paris (France) with each subway station represented by a red circle of radius
  .
.