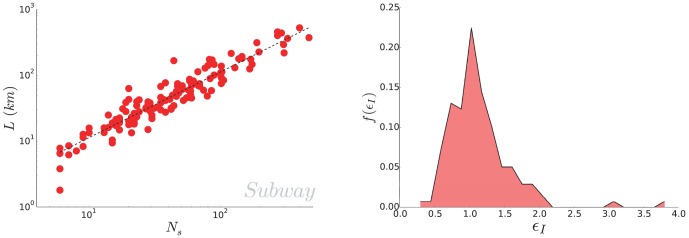
Figure 2. (Subway) Relation between the length and the number of stations.

(Left) Length of  subway networks in the world as a function of the number of stations. A linear fit gives
  (Right) Empirical distribution of the inter-station length. The average interstation distance is found to be
  and the relative standard deviation is approximately
  .
.
