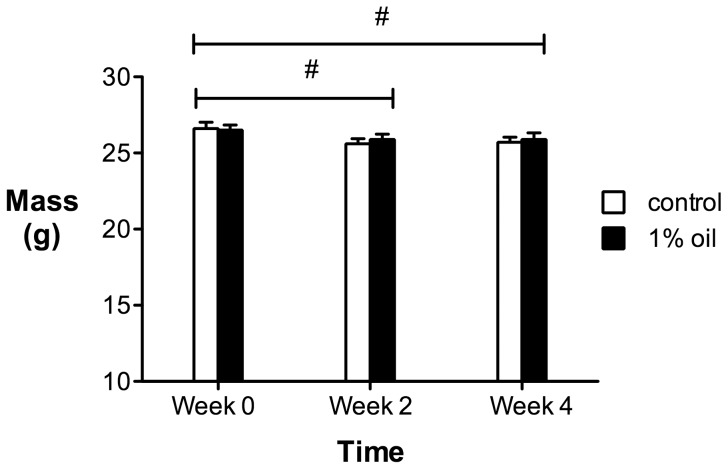
Figure 2. Body mass of house sparrows over four weeks of exposure to a 1% oil or control diet (n = 12 birds in each group).
The hash represents a small but significant decrease in body mass of both groups at two and four weeks compared to at the initiation of the feeding study. Values are presented as mean ± SEM.

