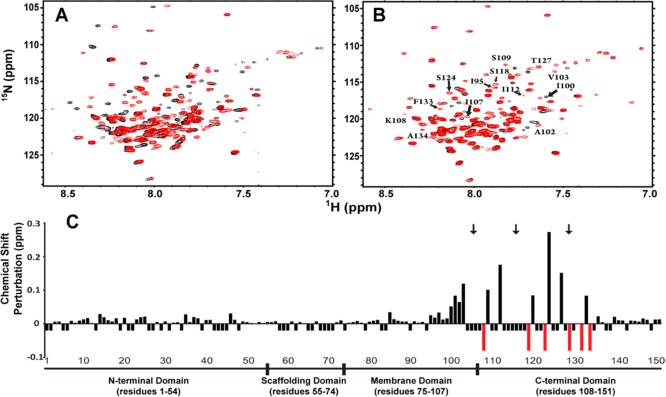
Figure 2.
Effects of mutation and lipidation on the structural properties of Cav3. (A) 1H–15N TROSY spectra of wild-type (WT) Cav3 (black) and 568C-Cav3 (red) in 100 mM imidazole (pH 6.5), 1 mM EDTA, 1 mM TCEP, 1.5 mM DSS, and 66 mM (WT) or 112 mM (568C-Cav3) LPPG were recorded on a 900 MHz NMR spectrometer. (B) The 1H–15N TROSY spectrum of lipidated 568C-Cav3 (red) in 100 mM imidazole (pH 6.5), 1 mM EDTA, 1 mM TCEP, 1.5 mM DSS, and 110 mM LPPG was recorded on a 900 MHz NMR spectrometer. Residues influenced by lipidation are indicated. The 1H–15N TROSY spectrum of nonlipidated 568C-Cav3 from panel A is plotted for reference (black). (C) The magnitude of the change in the chemical shift for each assigned amide resonance in the 1H–15N TROSY spectrum of lipidated Cav3 relative to 568C-Cav3 is indicated by the height of the bar. Negative bars indicate the positions for which the change in chemical shift could not be determined because of spectral overlap or missing assignments. Red bars indicate peaks seen only in the spectrum of lipidated 568C-Cav3. Black arrows indicate lipidation sites.

