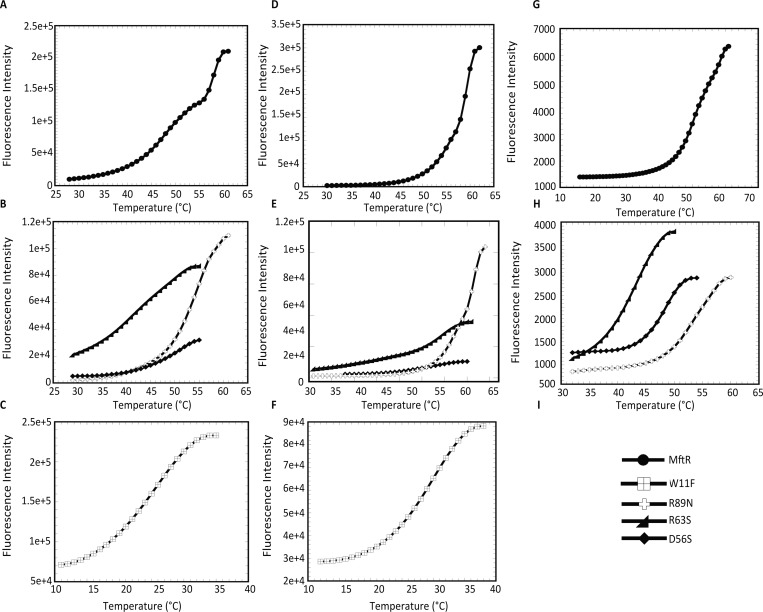
Figure 6.
Melting temperature of MftR and mutant proteins determined by differential scanning fluorometry. Thermal denaturation is represented by the fluorescence intensity resulting from the binding of SYPRO Orange to denatured protein as a function of temperature. (A) Thermal denaturation profile of WT MftR. (B) Thermal denaturation profile of D56S, R63S, and R89N. (C) Melting profile of W11F; a higher initial fluorescence may reflect the presence of already denatured protein. (D) Melting profile of WT with the addition of 100 μM urate. (E) Denaturation profile of D56S, R63S, and R89N with urate. (F) Denaturation profile of W11F with urate. (G) Thermal denaturation profile of MftR with 6 μM mftpO. (H) Denaturation profile of mutant D56S, R63S, and R89N with mftpO. (I) Symbols used in panels A–H for MftR and mutants.

