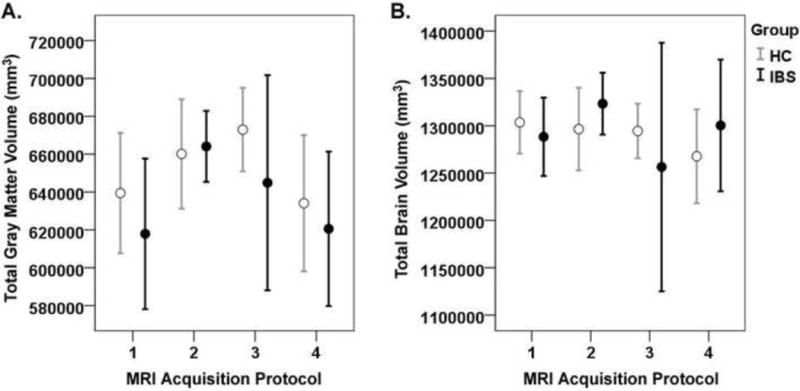
Figure 3.

Gray matter volume by study protocol.
These graphs depicts the mean total grey matter (A) and mean total brain volume (B) and ±95% confidence intervals by acquisition protocol (protocols 1, 2, 3, 4) and group (healthy controls (HCs) and irritable bowel syndrome patients (IBS)). Details of the protocols are described in Table 4.
